Quick Start
Uppasd_tools is designed to process UppASD simulation output and provide a convenient Python interface for inspecting, summarizing, and post-processing simulation results.
The output files of UppASD simulations are named as
prefix.SIMID.out, where SIMID is simulation id, 8-character string set in the UppASD main input file, inpsd.dat.
Ideally, all results of your simulation are stored in one directory.
To process these files, initialize UppOut object, which checks the directory, finds available output files,
and extracts available parameters.
from uppasd_tools import UppOut

uppout = UppOut('/path/to/UppASD/directory')
It is important, that all the output files share the same SIMID, which means they were produced by the same simulation.
In case, you have stored outputs of multiple simulations in the same directory, UppOut will raise an error.
You can correct it by specifying given SIMID.
uppout = UppOut('/path/to/UppASD/directory', simid='simid001')
Summarize UppASD directory
Once you initialized UppOut object, you can review the information gathered in the uppout instance.
This provides a quick overview of the simulation setup and available data,
which is often the first thing to check before any analysis.
uppout.summary()
Output directory: /path/to/UppASD/directory
Simulation ID: simid001
Available output files: ['averages', 'coord', 'cumulants', 'mcinitial', 'restart', 'stdenergy', 'struct', 'totenergy']
---
Number of atoms in the unit cell: 2
Number of atom types: 1
Total number of atoms in the supercell: 432
Number of ensembles in the simulation: 5
xrange: (0.0, 5.5)
yrange: (0.0, 5.5)
zrange: (0.0, 5.5)
Read UppASD output files
UppOut holds simulation ID in uppout.simid and prefixes of all available output files in uppout.prefixes.
To read an output file you can use any of the function listed
in uppasd_tools.uppout reference.
For instance to read the averages.simid001.out file use
df_averages = uppout.read_averages()
which returns a pandas DataFrame instance containing the data from the file
iter |
Mx |
My |
Mz |
M |
M_stdv |
|---|---|---|---|---|---|
… |
… |
… |
… |
… |
… |
The table contains averaged magnetization components and their standard deviation as a function of Monte Carlo iteration. More details on UppASD output files you can find in the UppASD Manual.
If you need to see final magnetic configurations, stored in restart.simid001.out file, use
final_configs = uppout.final_configs()
This will return list of pandas DataFrames. Each DataFrame contains magnetic configuration for one of the simulated member of the ensemble.
For more advanced usage examples, see the example Jupyter notebook.
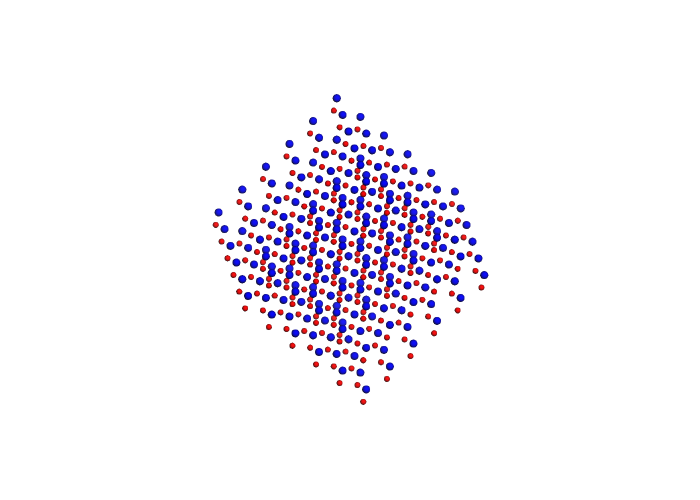
Visualize atomic structure
Uppasd_tools allows you to visualize the supercell generated by UppASD.
To this end uppasd_tools uses py3Dmol, which provides 3D interactive visualization
of the atomic structure.
from uppasd_tools.visualize import visualize_supercell

# Visualize the supercell structure
view = visualize_supercell(
    uppout,
    type_to_symbol={1: "Fe", 2: "Co"},
    symbol_to_color={"Fe": "red", "Co": "blue"},
    symbol_to_scale={"Fe": 0.06, "Co": 0.08},
    # xlim=(0,2), ylim=(0,2), zlim=(0, 2),
    scale=0.1, rotate=(30, 10, 45)
)
view.show()
Analogically, one can visualize static magnetic configurations.
To learn more about visualization in uppasd_tools visit uppasd_tools.visualize section or review the example Jupyter notebook.
Collect data
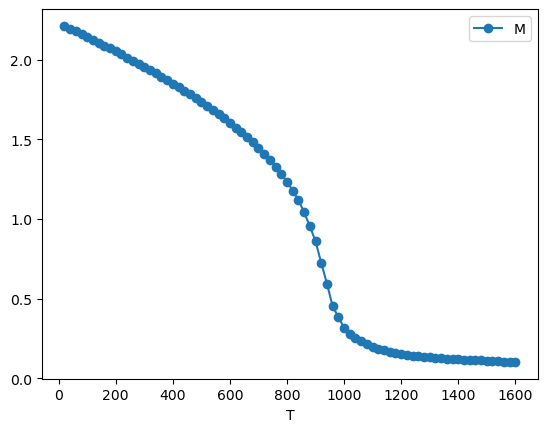
A typical use case of UppASD is the estimation of the Curie temperature using Monte Carlo simulations. In practice, one performs a series of simulations at different temperatures in order to obtain the temperature dependence of magnetization, specific heat, and the Binder cumulant.
If each simulation is stored in a separate directory, uppasd_tools.collect
can be used to read the outputs of multiple simulations and merge them into a
single temperature-dependent dataset.
For Curie temperature estimation one typically runs multiple Monte Carlo simulations at different temperatures. A convenient way to organize such a sweep is to keep all simulations under a single root directory, with one subdirectory per temperature.
A recommended directory layout is:
temp_root/
├── sim_T100K/
│   ├── inpsd.dat
│   ├── posfile
│   ├── momfile
│   ├── jfile
│   ├── averages.simid001.out
│   ├── cumulants.simid001.out
│   ├── stdenergy.simid001.out
│   └── restart.simid001.out
├── sim_T90K/
│   ├── inpsd.dat
│   ├── posfile
│   ├── momfile
│   ├── jfile
│   └── ...
└── sim_T80K/
    └── ...
The directory name (e.g. sim_T50K) can be treated as a template and used to
associate each simulation with its temperature value. The function
uppasd_tools.collect_averages iterates over all simulation directories, reads selected
output files, and merges the results into a single temperature-dependent dataset.
from uppasd_tools.collect import collect_averages

# Collect data from averages.simid.out files
df_aver = collect_averages('./temp_root', name_template='sim_T{T}', simid='simid001')
df_aver is a dataframe of the structure
T |
Mx |
My |
Mz |
M |
M_std |
|---|---|---|---|---|---|
100 |
… |
… |
… |
… |
… |
90 |
… |
… |
… |
… |
… |
80 |
… |
… |
… |
… |
… |
The table summarizes the temperature dependence of the averaged magnetization components and their standard deviation obtained from Monte Carlo simulations.
One can simply plot the resulting dependence.
df_aver.plot(x="T", y="M", marker="o")
Analogically one can use other functions listed in uppasd_tools.collect. An example of usage you can find in example Jupyter notebook.